AnaChart holds 660K+ price targets and 750K+ ratings from 7K+ named analysts on 9K+ US companies, past and present, since 2008, and every target is scored: reached or not, on what date, after how many days.
The dataset behind every query on this page is the one that feeds anachart.com, the $29 ticker files and the monthly Price Target Index. Analysts and brokers are resolved to one identity each, so a career that moves between firms stays one row. Below are five questions buyers open the data with and the SQL that answers each. Send us the question and we run it, or take a warehouse share and run it yourself.
At a glance
| Record | 660K+ price targets, 750K+ ratings, since 2008 |
| Identities | 7K+ analysts, 400+ brokers, one identity each across firms |
| Tickers | 9K+ US, listed and delisted |
| Outcome columns | Direction, met, date met, days to hit, on every target |
| Provenance | Source URL on 59% of rows and on every new row |
| Ways in | Question answered as a report (first free, then from $149); $29 single-ticker files; Snowflake or BigQuery share |
| Free | Apple file, 3,794 events, full file for an email address |
| Public pages | data.anachart.store, one page per ticker and analyst |
Score any analyst’s hit rate, by name
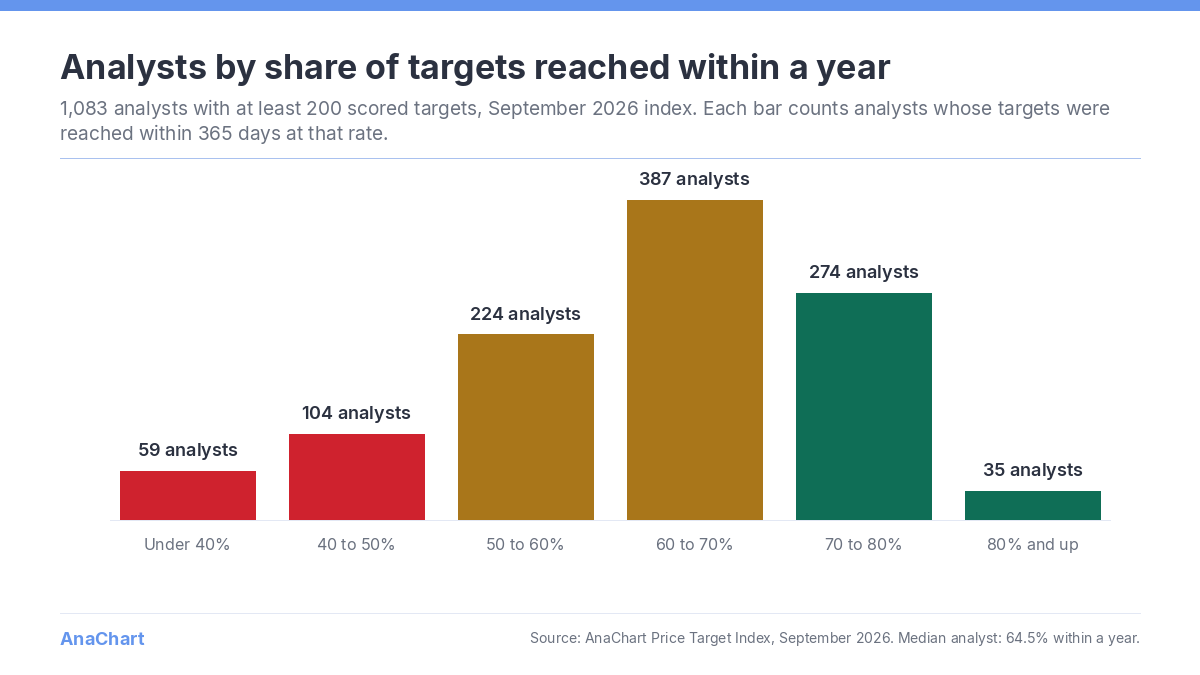
The same person covering Apple in 2007 and in 2026 is one analyst in this record, whatever firm the byline carried at the time. Each of that analyst’s targets is marked reached or not, with the date the stock first traded through it and the calendar days that took. A per-analyst record that runs back to 2008, is enough to compute a hit rate at any window you choose: 90 days, a year, or no limit.
The met, date met and days to hit columns are computed against end-of-day highs and lows with no time limit; the index page publishes both the 365-day and the no-limit share by year. The query below ranks analysts on their own targets; joining a price feed of your own lets you re-score at any horizon.
Show the SQL
WITH calls AS (
  SELECT
    a.canonical_analyst_name,
    a.date              AS call_date,
    a.price_target_after AS pt_target,
    -- close on the action that lands ~1 year after this call
    (SELECT close_price
       FROM PUBLIC.NASDAQPTRATINGS b
      WHERE b.ticker = a.ticker
        AND b.date BETWEEN DATEADD('day', 252, a.date) AND DATEADD('day', 365, a.date)
        AND b.close_price IS NOT NULL
      ORDER BY ABS(DATEDIFF('day', a.date, b.date) - 252)
      LIMIT 1)          AS close_1y
  FROM PUBLIC.NASDAQPTRATINGS a
  WHERE a.ticker = 'AAPL'
    AND a.price_target_after IS NOT NULL
)
SELECT
  canonical_analyst_name,
  COUNT(*)                                                                        AS calls_with_1y_followup,
  ROUND(AVG(ABS(pt_target - close_1y) / close_1y * 100), 2)                       AS avg_1y_error_pct,
  ROUND(SUM(IFF(ABS(pt_target - close_1y) <= 0.10 * close_1y, 1, 0))::FLOAT
        / COUNT(*) * 100, 2)                                                      AS within_10pct_rate
FROM calls
WHERE close_1y IS NOT NULL
GROUP BY canonical_analyst_name
HAVING COUNT(*) >= 5
ORDER BY within_10pct_rate DESC
LIMIT 25;
Email me this query and a sample cutGet the free AAPL sample
What a hit rate looks like on a real name
Five analysts covering Apple, with their full AAPL record from the live site. The query above returns rows like these for every analyst and ticker.
| Analyst | Firm | AAPL targets met | Met ratio |
|---|---|---|---|
| Wamsi Mohan | BofA Securities | 159 / 164 | 96.95% |
| Amit Daryanani | Evercore ISI | 154 / 159 | 96.86% |
| Erik Woodring | Morgan Stanley | 46 / 48 | 95.83% |
| Laura Martin | Needham | 55 / 55 | 100% |
| Krish Sankar | TD Cowen | 38 / 42 | 90.48% |
Build factor signals from analyst behavior
Price targets are numbers, ratings are categories, and each row carries both before and after the event. A Buy that stays a Buy while the target comes down is visible as a row where rating_before equals rating_after and price_target_after is below price_target_before. With target values before and after on every event, and the broker on each row, target momentum, dispersion across brokers and revision frequency can all be built and tested back to 2008.
The query below lists stock-day pairs on which more than one analyst lowered a price target without changing the rating.
Show the SQL
SELECT
  date,
  ticker,
  COUNT(*) AS total_actions,
  SUM(IFF(rating_after = rating_before
          AND price_target_after < price_target_before, 1, 0)) AS quiet_pt_cuts,
  SUM(IFF(rating_after = rating_before
          AND price_target_after > price_target_before, 1, 0)) AS quiet_pt_raises,
  SUM(IFF(rating_after_simplified = 'SELL'
          AND rating_before_simplified <> 'SELL', 1, 0))       AS new_downgrades_to_sell
FROM PUBLIC.NASDAQPTRATINGS
WHERE date >= DATEADD('year', -2, CURRENT_DATE())
  AND price_target_after  IS NOT NULL
  AND price_target_before IS NOT NULL
GROUP BY date, ticker
HAVING quiet_pt_cuts >= 2
ORDER BY date DESC, quiet_pt_cuts DESC
LIMIT 100;
Email me this query and a sample cut
Audit IR coverage from the inside
Every listed company has sell-side coverage, and the record holds it at the analyst level: who covered the ticker, when each target was set, whether it was reached, and who is still active. Pull the full history on one ticker and use it for IR Day preparation, sell-side prioritisation and earnings Q&A.
Show the SQL
WITH ranked AS (
  SELECT
    canonical_analyst_name,
    broker_number,
    rating_after,
    price_target_after,
    date,
    ROW_NUMBER() OVER (PARTITION BY canonical_analyst_name
                       ORDER BY date DESC) AS rn,
    COUNT(*)     OVER (PARTITION BY canonical_analyst_name) AS total_actions,
    MAX(date)    OVER (PARTITION BY canonical_analyst_name) AS last_action_date
  FROM PUBLIC.NASDAQPTRATINGS
  WHERE ticker = 'NVDA'
    AND date >= DATEADD('year', -5, CURRENT_DATE())
)
SELECT
  canonical_analyst_name,
  broker_number,
  rating_after          AS current_rating,
  price_target_after    AS current_target,
  last_action_date,
  total_actions,
  IFF(last_action_date >= DATEADD('day', -90, CURRENT_DATE()),
      'ACTIVE', 'STALE') AS coverage_status
FROM ranked
WHERE rn = 1
ORDER BY total_actions DESC;
Email me this query and a sample cut
Rebuild consensus on your own weighting
Consensus on a terminal is one number. With event-level history and the source on each row, consensus can be rebuilt on any weighting: equal, recency, or accuracy, using each analyst’s own reached share on that ticker. Where the weighted number and the simple average diverge, the rows that cause the gap are visible.
The query below builds an accuracy-weighted consensus target for AAPL: each analyst’s most recent target is weighted by the share of that analyst’s past AAPL targets that were reached, and the result is compared with the equally weighted average.
Show the SQL
WITH at_call_accuracy AS (
  SELECT
    canonical_analyst_name,
    SUM(IFF(ABS(price_target_after - close_price) <= 0.10 * close_price, 1, 0))::FLOAT
      / NULLIF(COUNT(*), 0) AS accuracy
  FROM PUBLIC.NASDAQPTRATINGS
  WHERE ticker = 'AAPL'
    AND close_price > 0
    AND price_target_after IS NOT NULL
  GROUP BY canonical_analyst_name
  HAVING COUNT(*) >= 5
),
latest_target AS (
  SELECT
    canonical_analyst_name,
    price_target_after AS current_target,
    ROW_NUMBER() OVER (PARTITION BY canonical_analyst_name
                       ORDER BY date DESC) AS rn
  FROM PUBLIC.NASDAQPTRATINGS
  WHERE ticker = 'AAPL'
    AND price_target_after IS NOT NULL
)
SELECT
  COUNT(*)                                                                AS contributing_analysts,
  ROUND(AVG(current_target), 2)                                           AS simple_consensus,
  ROUND(SUM(current_target * accuracy) / NULLIF(SUM(accuracy), 0), 2)     AS accuracy_weighted_consensus
FROM latest_target l
JOIN at_call_accuracy a USING (canonical_analyst_name)
WHERE l.rn = 1;
Email me this query and a sample cutGet the free AAPL sample
Defend research with source-level provenance
59% of rows carry the source URL of the article the event was parsed from, and every row added since link capture began carries one. Duplicates across feeds are removed and analyst firm moves are resolved to one identity. For work that has to defend its provenance, a publication, testimony, a compliance review, a client note, each linked event traces back to a public disclosure.
Show the SQL
SELECT
  date,
  ticker,
  rating_before_simplified || ' -> ' || rating_after_simplified AS rating_change,
  price_target_before,
  price_target_after,
  (price_target_after - price_target_before) AS pt_change,
  source_url
FROM PUBLIC.NASDAQPTRATINGS
WHERE canonical_analyst_name = 'TONI SACCONAGHI'
ORDER BY date;
Email me this query and a sample cut
What is in the dataset
The full table, a ticker set, a broker, or a date range, delivered as a CSV cut or as a Snowflake or BigQuery share into your own account.
Access
We run the query and send back a report; the first question is free and further questions start at $149. Single S&P 500 and Nasdaq-100 tickers are sold as ready files at $29 each, delivered in a minute. Anything wider is quoted to the job. Every ticker and analyst also has a summary page at data.anachart.store.
Free Apple sample: 100-row preview to download, full file on request
No warehouse account? The custom data reports service delivers the same data as a report: describe the question in plain English, we query the record and send Excel or PDF, usually the same day and within 48 hours. From $149.
Talk to us: [email protected] · Calendly
Frequently asked questions
What data do these queries run on?
AnaChart’s analyst price target record: 660K+ price targets and 750K+ ratings across 7K+ analysts and 9K+ companies, past and present, from 2008. Every target carries its outcome columns (direction, met, date met, days to hit) and every analyst carries a reached share computed from them.
Can I get these as a Snowflake or BigQuery share?
Yes. The full dataset ships as a native Snowflake or BigQuery share, or as a one-time report if you do not run a warehouse. Single S&P 500 and Nasdaq-100 tickers are $29 files.
How do I try the data before buying?
Start with the free Apple file: a 100-row preview to download with no account, and the full file with every analyst on AAPL and the outcome columns sent to a work email address on request. Then read the analyst price target data overview for the scoring method.