At a glance
| Ticker | Apple (AAPL) |
| Events | 3,794 analyst actions, August 2005 to April 2026 |
| Analysts | 126, one identity each across firms |
| Scored targets | 3,374; 3,192 reached with no time limit (94.6%) |
| Time to hit | Median 139 days, mean 223 |
| Columns | Fifteen, including the two closing-price columns the $29 files omit |
| Preview | Most recent 100 events, download below |
| Full file | Sent to a work email address on request |
The Apple file
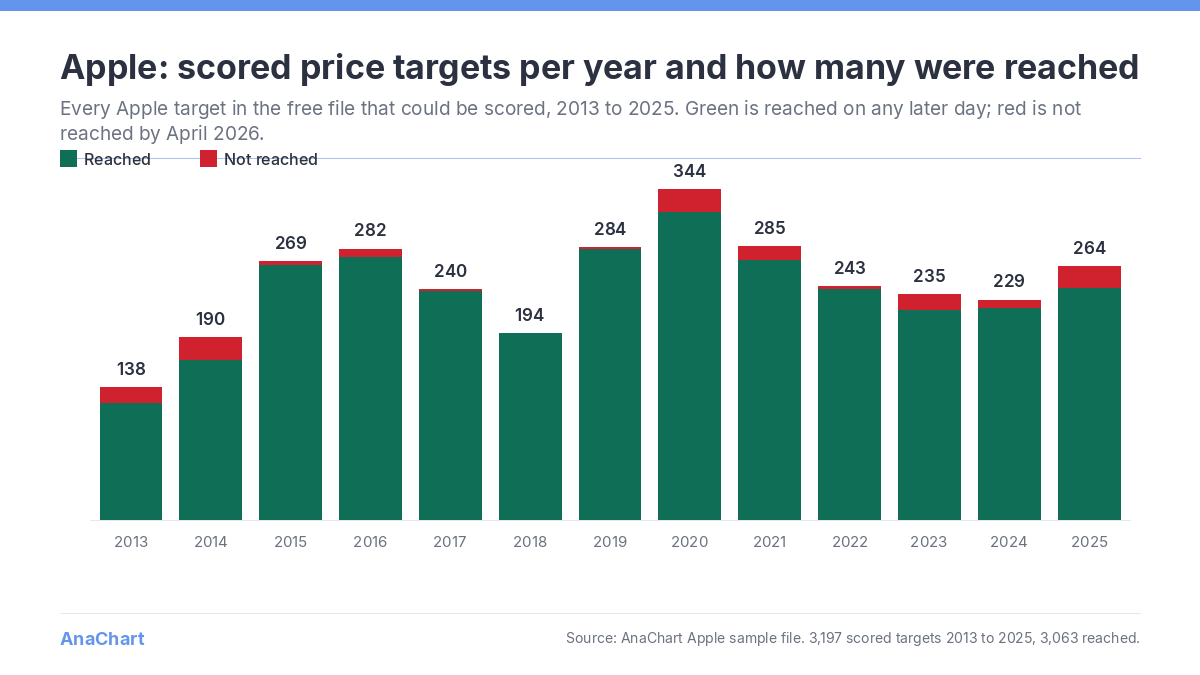
One ticker out of the AnaChart record, cut and scored the same way as the rest of it. The full Apple file holds 3,794 analyst events between August 2005 and April 2026 across 126 named analysts. Every price target carries the date it was set, the closing price that day, and what the stock did afterwards.
The outcome columns record whether the stock reached the target and how long it took. Across the full file, 3,374 targets could be scored and 3,192 were reached, a rate of 94.6%. The median took 139 days, the mean 223.
The preview below is the most recent 100 events, free to download. It carries every column the full file carries. The complete file is sent on request to a work email address.
The columns
date | Day the analyst action was published |
analyst | Canonical analyst name, deduped across spellings and feeds |
broker_number | Internal broker identifier |
rating_before, rating_after | Simplified rating either side of the action |
price_target_before, price_target_after | Split-adjusted targets |
pt_after_nominal | The target as printed on the day, before any split |
split_ratio | Cumulative split factor applied |
close_price_adj | Adjusted close on the event date |
close_nominal_on_date | Raw close on the event date, the reference the target is judged against |
target_direction | up or down, set by the target against that day’s close |
target_met | yes or no |
date_met | First day the stock traded through the target |
days_to_hit | Calendar days from the call to that day |
How a target gets scored
Met is directional. If the target sits above the price on the day it was published, the stock has to trade up through it. If it sits below, the stock has to trade down to it. A target of $180 set on a $200 stock is scored on the stock reaching $180.
There’s no deadline. A target reached in three years counts, and the file tells you it took three years. Time is kept as a separate column rather than applied as a cutoff. Scoring runs against raw daily highs and lows so no dividend adjustment creeps into the comparison.
What this file doesn’t do
- It stops on 14 April 2026. This is a dated snapshot rather than the live feed. A current cut is available on request.
- 420 rows carry no target at all, or one that sits exactly at that day’s close. They stay in the file with the scoring columns blank. Dropping them would understate how much an analyst published.
- Source links are stripped from the free cut. They’re in the licensed data, one per call where we hold it, on 59% of the full record.
- One ticker. Apple carries deeper coverage than most names, so these figures are not representative of the full record.
What you may do with it
Internal use is permitted: load it, test it, check it against your own price history, circulate it inside your organisation. Publishing it, redistributing it, or building a product on it requires a licence. Please attribute AnaChart if you quote a figure from it.
Request the full file
Leave an address and the complete file is sent straight over. No form, no vetting call. Other tickers, a sector, a single broker’s desk, a date range, or the full universe on Snowflake or BigQuery can be quoted the same way.