The AnaChart Price Target Index is one number, recomputed monthly at this address, from the full AnaChart record of published Wall Street price targets: what share of them the stock went on to reach, by year of issue and by analyst. This edition was computed on 4 September 2026 from 830K+ analyst actions with prices through that date. The method is printed below, the tables are downloadable, and the page updates in place each month.
At a glance
| What it measures | Share of published price targets the stock went on to reach |
| Two cuts | Reached within 365 days of issue, and reached on any later day with no limit |
| Scored targets | 639,823 in the September 2026 edition |
| Reached, no limit | 493,725, or 77.2% |
| By year | 2013 to 2025, with median days to hit |
| Implied move | Median target 16.1% from the close on the day it was published, across all 639,823 scored targets; 85.6% of targets sat above the close |
| By analyst | Both ends of the table by name, 200 scored targets minimum |
| Update | Monthly, in place, same address |
| Download | Year table and analyst table as CSV, free |
The number
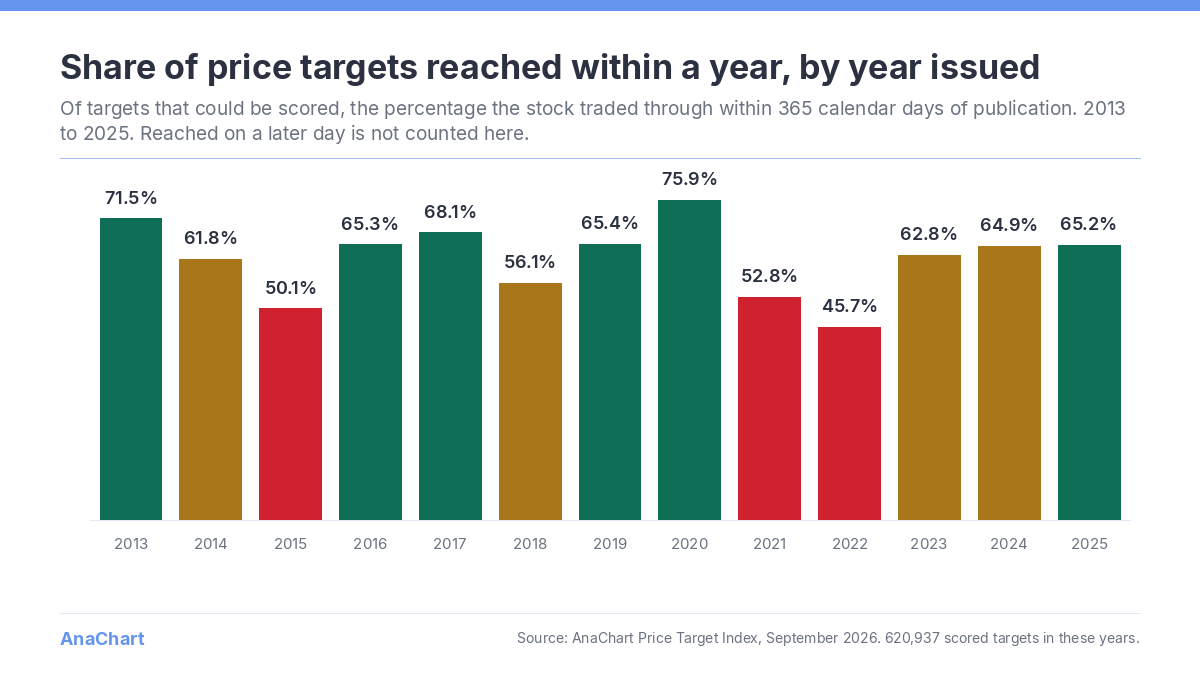
Of 639,823 price targets that could be scored, 493,725 were reached at some later date with no time limit: 77.2%. Within 365 days of publication, the share by year of issue:
| Issued | Scored | Reached within 365 days | Reached, no limit | Median days to hit |
|---|---|---|---|---|
| 2013 | 3,632 | 71.5% | 93.0% | 105 |
| 2014 | 8,506 | 61.8% | 88.4% | 147 |
| 2015 | 13,124 | 50.1% | 87.4% | 259 |
| 2016 | 18,733 | 65.3% | 89.4% | 142 |
| 2017 | 23,254 | 68.1% | 88.8% | 113 |
| 2018 | 31,545 | 56.1% | 86.8% | 162 |
| 2019 | 37,813 | 65.4% | 88.7% | 122 |
| 2020 | 58,818 | 75.9% | 88.0% | 64 |
| 2021 | 73,348 | 52.8% | 70.8% | 92 |
| 2022 | 69,906 | 45.7% | 70.4% | 170 |
| 2023 | 77,609 | 62.8% | 77.9% | 104 |
| 2024 | 91,783 | 64.9% | 76.6% | 83 |
| 2025 | 112,866 | 65.2% | 68.7% | 70 |
Reading rule: the no-limit column for recent years is still rising, because the stock has had less time. The 365-day column is comparable across years. Download the year table (CSV).
Analysts with 200 or more scored targets
1,083 analysts in the record have 200 or more scored price targets. The table ranks them on the share reached within 365 days, with the count of targets and tickers beside each name. Both ends of the table are printed. Download all 1,083 rows (CSV).
Highest share reached within 365 days
| Analyst | Scored targets | Reached within 365 days | Tickers | Share |
|---|---|---|---|---|
| Brandon King | 356 | 317 | 37 | 89.0% |
| Joe Quatrochi | 277 | 240 | 21 | 86.6% |
| Glenn Schorr | 238 | 205 | 26 | 86.1% |
| John Pancari | 241 | 206 | 30 | 85.5% |
| Richard Davis | 393 | 335 | 41 | 85.2% |
| Philip Gibbs | 272 | 228 | 32 | 83.8% |
| Michael Phillips | 209 | 175 | 30 | 83.7% |
| Atif Malik | 538 | 450 | 31 | 83.6% |
| Manuel Navas | 207 | 173 | 38 | 83.6% |
| Richard Shane | 735 | 614 | 46 | 83.5% |
| Frank Schiraldi | 209 | 174 | 33 | 83.3% |
| Theresa Chen | 379 | 315 | 47 | 83.1% |
| David Konrad | 334 | 277 | 40 | 82.9% |
| Mitch Steves | 361 | 298 | 26 | 82.5% |
| Andrew Liesch | 245 | 202 | 33 | 82.4% |
| Leo Mariani | 435 | 358 | 52 | 82.3% |
| Michael Brown | 392 | 322 | 46 | 82.1% |
| Brian Chin | 290 | 238 | 33 | 82.1% |
| Joshua Buchalter | 211 | 173 | 24 | 82.0% |
| David Vogt | 272 | 223 | 18 | 82.0% |
| Mike Dahl | 803 | 655 | 52 | 81.6% |
| Vivek Juneja | 201 | 164 | 15 | 81.6% |
| Christopher Harris | 223 | 182 | 26 | 81.6% |
| Gerard Cassidy | 337 | 275 | 22 | 81.6% |
| Rick Schafer | 299 | 243 | 15 | 81.3% |
Lowest share reached within 365 days
| Analyst | Scored targets | Reached within 365 days | Tickers | Share |
|---|---|---|---|---|
| Patrick Trucchio | 362 | 72 | 48 | 19.9% |
| Liana Moussatos | 253 | 53 | 39 | 20.9% |
| Edward White | 449 | 98 | 51 | 21.8% |
| Francois Brisebois | 219 | 53 | 49 | 24.2% |
| Yasmeen Rahimi | 422 | 102 | 78 | 24.2% |
| Joseph Pantginis | 960 | 250 | 122 | 26.0% |
| Steven Seedhouse | 278 | 73 | 49 | 26.3% |
| Ross Osborn | 258 | 69 | 26 | 26.7% |
| Yi Chen | 619 | 166 | 77 | 26.8% |
| Jason McCarthy | 369 | 99 | 146 | 26.8% |
| Derrick Whitfield | 304 | 83 | 52 | 27.3% |
| Todd Brooks | 216 | 59 | 25 | 27.3% |
| Serge Belanger | 479 | 133 | 41 | 27.8% |
| Ed Arce | 575 | 163 | 61 | 28.3% |
| Conor McNamara | 203 | 58 | 14 | 28.6% |
| Bradley Canino | 227 | 65 | 36 | 28.6% |
| Geulah Livshits | 218 | 64 | 44 | 29.4% |
| Gil Blum | 386 | 115 | 31 | 29.8% |
| Elemer Piros | 223 | 67 | 62 | 30.0% |
| Kristen Kluska | 323 | 98 | 58 | 30.3% |
| Ivan Feinseth | 375 | 114 | 74 | 30.4% |
| Brandon Folkes | 210 | 64 | 63 | 30.5% |
| Jason Kolbert | 395 | 121 | 96 | 30.6% |
| Emily Bodnar | 315 | 97 | 38 | 30.8% |
| Amit Dayal | 333 | 108 | 82 | 32.4% |
Method
Direction is the target against the raw close on the issue date. A target is reached when the stock trades through it in that direction, on the issue day or any later day, tested against the raw daily high or low. Within 365 days means reached with days to hit of 365 or fewer. Targets are kept as printed; prices are raw, not dividend-adjusted, so a dividend adjustment cannot move a target across the line. Delisted, acquired and renamed names stay in with their full history. Analysts are resolved to one identity across firms. A target equal to the close on its day, or a row with no target or no price, is left unscored and is not counted in either column. The analyst threshold is 200 scored targets, chosen so that a record of twenty calls does not sit beside a record of two thousand; the window is 365 days, chosen so that years can be compared. Both thresholds are printed here and in the CSV.
The record grows by 300+ price targets on a normal trading day. The index is recomputed monthly and this page is updated in place; each CSV carries its computation date in the filename. Earlier editions remain downloadable from this page as they accumulate.
Where the rows come from
Every row in the index is one published analyst action in the AnaChart record, 660K+ price targets and 750K+ ratings across 9K+ US companies, past and present since 2008. Any ticker in the S&P 500 or Nasdaq-100 is available as a scored file for $29; the Apple file is free; a question about any analyst, ticker or broker in the index is answered as a report, the first one free.
Frequently asked questions
How often is the index updated?
Monthly, in place at this address. The current edition was computed on 4 September 2026. The CSV filename carries the computation date.
Why do the two “reached” columns differ so much for 2025?
A target issued in 2025 has had at most about a year for the stock to reach it. The no-limit column keeps rising as time passes; the 365-day column is fixed once a year has elapsed and is the one to compare across years.
Why 200 targets and 365 days?
200 scored targets keeps the ranking to analysts with a long record; 1,083 qualify. 365 days matches the horizon most brokers state for a target and makes years comparable. Both are printed so the choice is visible.
Where are the per-ticker and per-analyst figures?
At data.anachart.store. Every ticker and every named analyst in the record has a page with the count of targets, the share reached, the median days to hit and the same figures by year, computed by the method on this page.