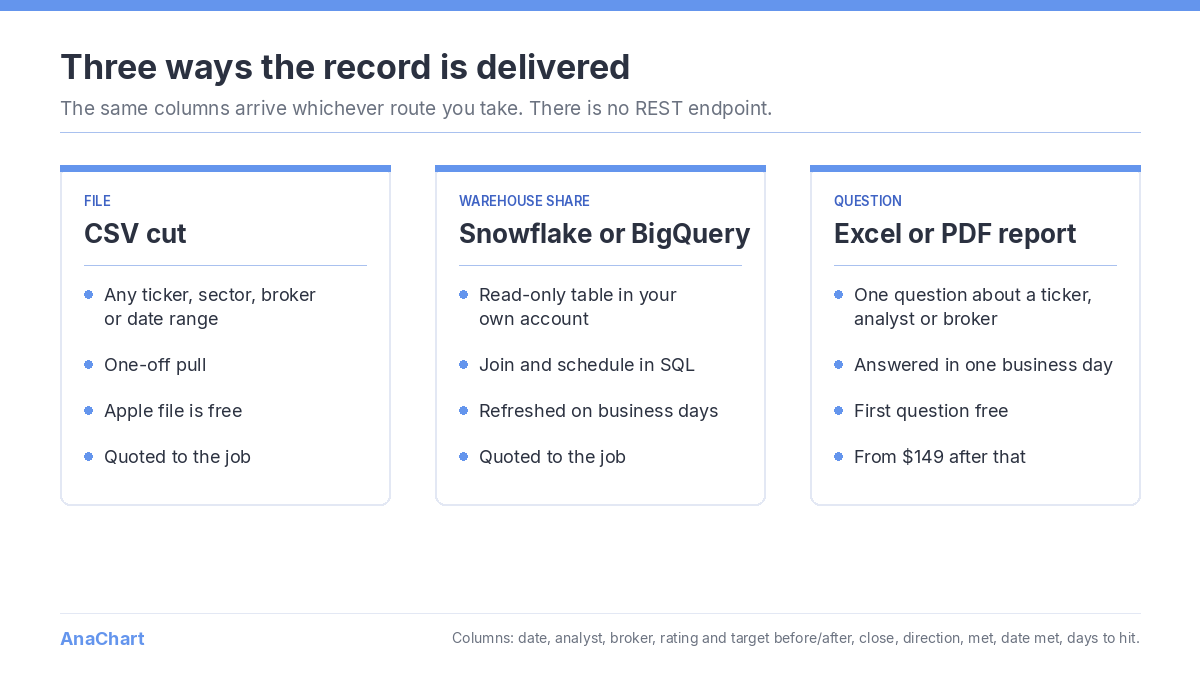
If you are looking for an analyst price target API, here is the plain answer first: AnaChart does not run a REST API. The 660,000+ price targets and 759,000+ ratings in the record are delivered two other ways, as a file or as a Snowflake or Google BigQuery share into your own account, and any question about them is answered as a report. This page explains what each route gives you, what the rows look like, and how the warehouse share covers the jobs an API is usually wanted for.
At a glance
| REST or JSON endpoint | None |
| Delivery | CSV file, or a Snowflake or Google BigQuery share into your own account |
| Refresh | Business days for a share |
| Coverage | 9,600+ US tickers, current and delisted, from 2004 |
| Volume | 660,000+ price targets and 759,000+ rating events, growing by 300+ targets a day |
| Fields | Date, analyst, broker, rating and target before and after, close, direction, met, date met, days to hit |
| Pricing | File and share quoted to the job; questions first free, then from $149 |
| Free sample | Apple, 3,794 events, full file for an email address |
What people use a price target API for
Four jobs come up most often. Pulling the current target and rating for a list of tickers into a screen or a dashboard. Pulling the full history for a ticker to backtest something. Joining analyst outcomes onto a factor model. Refreshing all of that on a schedule without a person in the loop. An endpoint that returns JSON is one way to do those. A table that already sits in your warehouse is another; for the last three, the join and the schedule are things the warehouse already does.
What a Snowflake or BigQuery share is
A share is a read-only table that appears inside your own Snowflake or BigQuery account, scoped to the tickers, fields and history you asked for. You query it with SQL like any other table, join it to your own price series or holdings, and schedule whatever you would have scheduled against an API. There is no ingestion code, no rate limit, no pagination, and nothing to keep alive on your side. AnaChart refreshes the share on business days. The data feed page covers the mechanics.
What a row looks like
The same fields arrive whether you take a file or a share. The Apple sample carries all of them and is the fastest way to see the shape before asking for anything.
date | Day the analyst action was published |
analyst | Canonical analyst name, one identity across firms |
broker_number | Broker identifier |
rating_before, rating_after | Simplified rating either side of the action; the broker’s printed label is also kept |
price_target_before, price_target_after | Split-adjusted targets |
pt_after_nominal, split_ratio | The target as printed, and the cumulative split factor |
close_nominal_on_date | Raw close on the event date, the reference for scoring |
target_direction, target_met, date_met, days_to_hit | Whether the stock reached the target, when, and how many calendar days it took |
The outcome columns are what the record adds over a plain target feed. On the live Apple record at anachart.com, Aaron Rakers at Wells Fargo shows 64 of 66 targets reached with an average of 321 days to hit, and Tim Long at Barclays shows 56 of 76 with an average of 124 days. Those figures are computed from these columns, and a share gives you the rows to compute them yourself.
The file route
For a one-off pull, a file is simpler than a share. Any cut, a ticker, a sector, a broker’s whole desk, a date range, is delivered as a CSV with the same columns. The Apple file is the worked example: 3,794 events from August 2005 to April 2026, 3,374 of them scored, 3,192 reached, median 139 days. A 100-row preview downloads with no account; the full file is sent to any address you give.
The question route
Many API requests are one query in disguise: which analysts on this ticker reached their targets most often, how long the targets on this sector took to hit, how the brokers we pay compare. Those are answered as a formatted Excel or PDF report inside one business day. The first question is free. Further questions start at $149 on the query catalog, and the form is on the homepage.
Coverage and sourcing, whichever route you take
The record runs from 2004 and is dense from 2013. It covers 9,600+ US tickers, including names that have since been delisted, acquired or renamed, which stay in with their full history. Analyst actions are parsed from around eight public feeds; each row keeps a reference to where it came from, and about 59% of the full record carries a direct link to the source. Analysts are resolved to one identity across firm moves, so a share joined on the analyst field does not split one person into two.
What is not in it: intraday timing, the text of the research note, and any action that was never published on a feed AnaChart reads. Those limits are the same for a file, a share and a report.
Which route fits which job
| Job | Route |
|---|---|
| One answer about a ticker, analyst or broker | Question, answered as a report |
| Full history of one or a few tickers for a backtest | File |
| Join outcomes onto a model, refreshed on a schedule | Snowflake or BigQuery share |
| Check the shape of the data before asking for anything | Apple sample, free |
Frequently asked questions
Is there a REST or JSON API for analyst price targets?
Not from AnaChart. The record is delivered as a file or as a Snowflake or BigQuery share, and questions are answered as reports. A share covers the scheduled-pull and join cases an API is usually wanted for; the Apple sample shows the columns you would get.
Can I get the current target and rating for a list of tickers?
Yes, as a file cut or as a share filtered to your list. Each ticker’s rows carry the latest target and rating per analyst; on Apple that is, for example, Samik Chatterjee at JPMorgan, Buy since 10 January 2019, current target $340, previous $325.
How often is a share refreshed?
On business days, unless the quote states a different cadence. The record itself grows by 300+ price targets on a normal trading day.
What does a share or a file cost?
Quoted to the job: the tickers, the history, the fields and the term. Questions are priced separately, first free and from $149 after that. The Apple file is free.
What is an analyst price target?
The price an analyst states a stock is expected to reach, published alongside a rating and usually with a twelve-month horizon. In the record each target is one row with the date, the target before and after, the rating before and after, and the close that day. Samik Chatterjee at JPMorgan on Apple, for example, shows a current target of $340 and a previous target of $325 on the live record.
How accurate is an analyst price target?
The record marks each target reached or not, with the date and the days it took, so the answer is per target and per analyst. On the live Apple record, Aaron Rakers at Wells Fargo shows 64 of 66 targets reached with an average of 321 days, and Tim Long at Barclays shows 56 of 76 with an average of 124 days. The historical price targets page sets out the scoring rules.
Try it on Apple, or ask a question
A 100-row Apple preview downloads free, no account. The full Apple file, 3,794 targets each marked reached or not with the days it took, is sent to any address you give us. The first question you ask is answered free; further queries from $149.