An analyst ratings history dataset records every rating an analyst has held on a stock, with the date each one began and the rating it replaced. AnaChart’s holds 750K+ rating events from 7K+ analysts at 400+ brokers across 9K+ US companies, past and present, next to the price targets that were published with them. This page sets out what a rating row contains, how ratings are normalised, what the dataset can and cannot answer, and how to get it.
At a glance
| Rating events | 750K+, growing daily |
| Analysts | 7K+ across 400+ brokers, active and retired, one identity per person |
| Coverage | 9K+ US companies, past and present, current and delisted |
| History | Since 2008 |
| Rating fields | Rating before and after, as printed and simplified to Buy, Hold, Sell |
| In the same row | Price target before and after, close that day, outcome columns |
| Point in time | Rows are never restated |
| Delivery | CSV file, Snowflake or BigQuery share, or a question answered as a report |
| Free sample | Apple, 3,794 events, 2005 to 2026, full file for an email address |
What a rating row holds
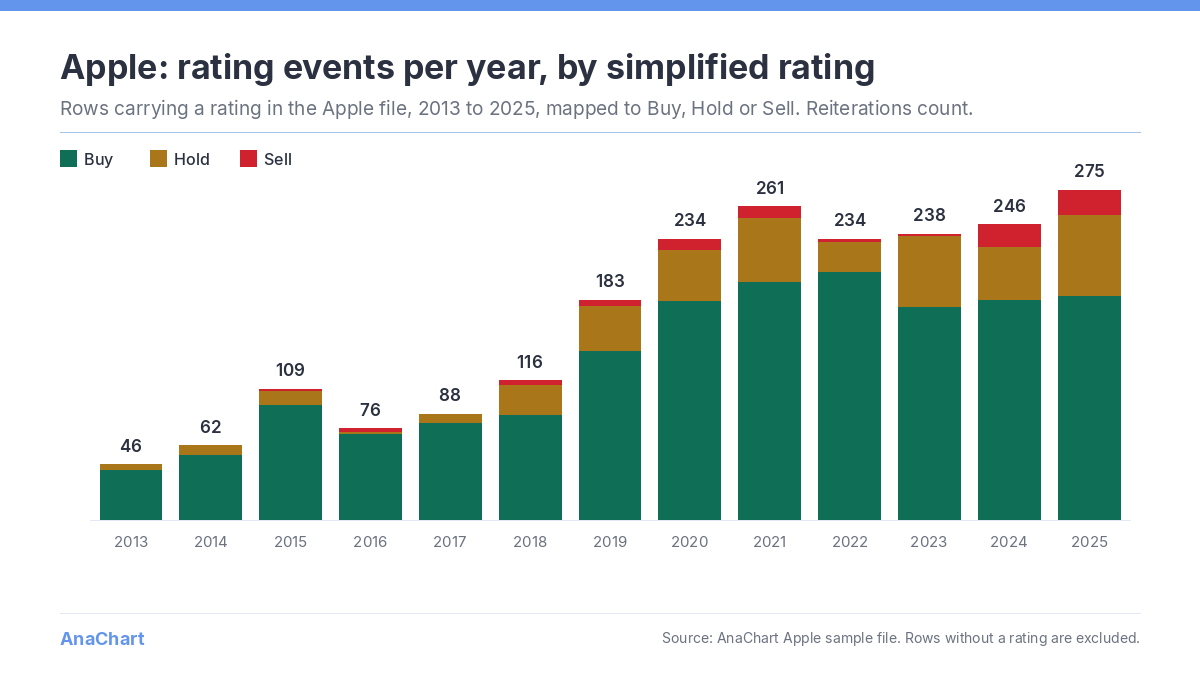
One row per rating action. The analyst, resolved to one identity across firms. The broker. The date the action was published. The rating before and the rating after, both as the broker printed them and in a simplified form. The price target before and after, if one was published alongside. The closing price that day. A reference to the source the action was parsed from. When an analyst reiterates a rating with a new target, that is a row too, so the table shows how long a rating was held and how many times the target moved underneath it.
On the live Apple record at anachart.com, Aaron Rakers at Wells Fargo shows Buy since 13 April 2020, Tim Long at Barclays shows Sell since 10 January 2024, and Edison Lee at Jefferies shows Hold since 16 December 2025. Each of those “since” dates is the date of the row where the rating took its current value; any rows before it hold what the analyst published on the name earlier.
Raw and simplified ratings
Brokers use their own vocabularies. Overweight, Outperform, Buy, Accumulate, Positive and Conviction Buy are six labels for a view above neutral. The dataset keeps the label as printed in rating_after and also carries rating_after_simplified, which maps every label to Buy, Hold or Sell. The same pair exists for the rating before the action. Analysis that needs the broker’s exact term uses the raw field; analysis that needs to compare across brokers uses the simplified one. Both are in every row, so nothing has to be re-mapped later.
Ratings and targets in the same row
Most ratings datasets stop at the label. This one keeps the price target that came with it and scores that target on whether the stock reached it and how many days it took. So a rating history can be read against outcomes. A Buy rating held for six years is one fact; the share of the targets published under that rating which the stock went on to reach is a second fact, and it sits in the same table. On the live Apple record, Samik Chatterjee at JPMorgan has held Buy since 10 January 2019 with 100 of 101 targets reached; Barton Crockett at Rosenblatt has held Hold since 28 July 2025 with 31 of 33 reached.
The Apple sample file shows the layout: 3,794 events, each with rating before and after, target before and after, and the outcome columns. Of the 3,374 targets in it that could be scored, 3,192 were reached; the median took 139 days.
How far back, and how dense
Rating rows run since 2008. The rating side of the record is larger than the target side, 750K+ against 660K+, because around 160,000 rating rows carry no price target: the rating was published or reiterated on its own.
Point in time, not restated
Rows are never rewritten after the fact. The rating an analyst held on a given date is the rating the row shows for that date, whatever happened later. Delisted and acquired tickers stay in with their full rating history. That matters for any backtest of consensus or rating changes; the post on point-in-time analyst data covers why a restated or survivor-only history inflates results.
What the ratings dataset can answer
- How long each analyst has held their current rating on a stock, and what they held before it.
- How many Buy, Hold and Sell ratings a stock carried on any past date, from the rows as they stood.
- How often a rating change coincided with a target change, per analyst or per broker.
- Which targets published under a given rating were reached, and how quickly.
- How the rating distribution on a stock moved over a period, without survivorship.
What it does not answer
- Whether a rating was right. The dataset scores targets, which are numbers, not ratings, which are labels.
- What the analyst wrote in the note. Only the action is recorded.
- Ratings that were never published on a feed AnaChart reads.
How to get it
The Apple file is free from the sample page: a 100-row preview with no account, the full file for an address. A question about ratings on any ticker, analyst or broker is answered as a report; the first is free, further from $149 on the query catalog. A cut of the full ratings history is delivered as a file or as a Snowflake or BigQuery share, quoted to the job.
Frequently asked questions
How do you handle brokers with different rating scales?
The broker’s label is kept as printed, and a simplified Buy, Hold or Sell is stored beside it. Wells Fargo’s rating on Apple appears as the broker prints it and as Buy; Barclays’ appears as printed and as Sell.
Does a reiterated rating create a new row?
Yes, when it is published as an action. That is why the record holds 750K+ rating events against 660K+ price targets. Samik Chatterjee’s Buy on Apple dates from 10 January 2019, and his 101 scored Apple targets are 101 rows.
Can I see the rating an analyst held on a specific past date?
Yes. Rows are point in time. The rating on a date is the most recent row on or before it, and nothing is restated afterwards. Tim Long’s Sell on Apple, for example, has a start date of 10 January 2024 on the live record; before that row he held a different rating, and that earlier row is still there.
Is the ratings history in the free Apple sample?
Yes. Every row in the Apple file carries rating before and after, along with the target and outcome columns. The 100-row preview is the most recent 100 events; the full file is 3,794.
Try it on Apple, or ask a question
A 100-row Apple preview downloads free, no account. The full Apple file, 3,794 targets each marked reached or not with the days it took, is sent to any address you give us. The first question you ask is answered free; further queries from $149.