Every published analyst price target on the S&P 500 or Nasdaq-100 ticker you name, from the first row in the record (since 2008) to the latest refresh, with whether the stock reached each target, the date it did, and how many calendar days that took. Fourteen columns: the free Apple file shows the layout, minus its two closing-price columns and plus an implied move column, each target against the close on the day it was published, in percent.
One-time payment, nothing renews. Digital file, not returnable once the link is sent; refunded in full if the ticker is outside the eligible set or the file cannot be delivered. Licence terms.
At a glance
| What you get | One CSV, one S&P 500 or Nasdaq-100 ticker, every price target on record |
| Columns | Fourteen: date, analyst, broker, rating and target before/after, nominal target, split ratio, implied move, direction, met, date met, days to hit |
| History | Since 2008, to the last refresh |
| Scoring | Reached if the stock traded through the target on the issue day or any later day; no time limit |
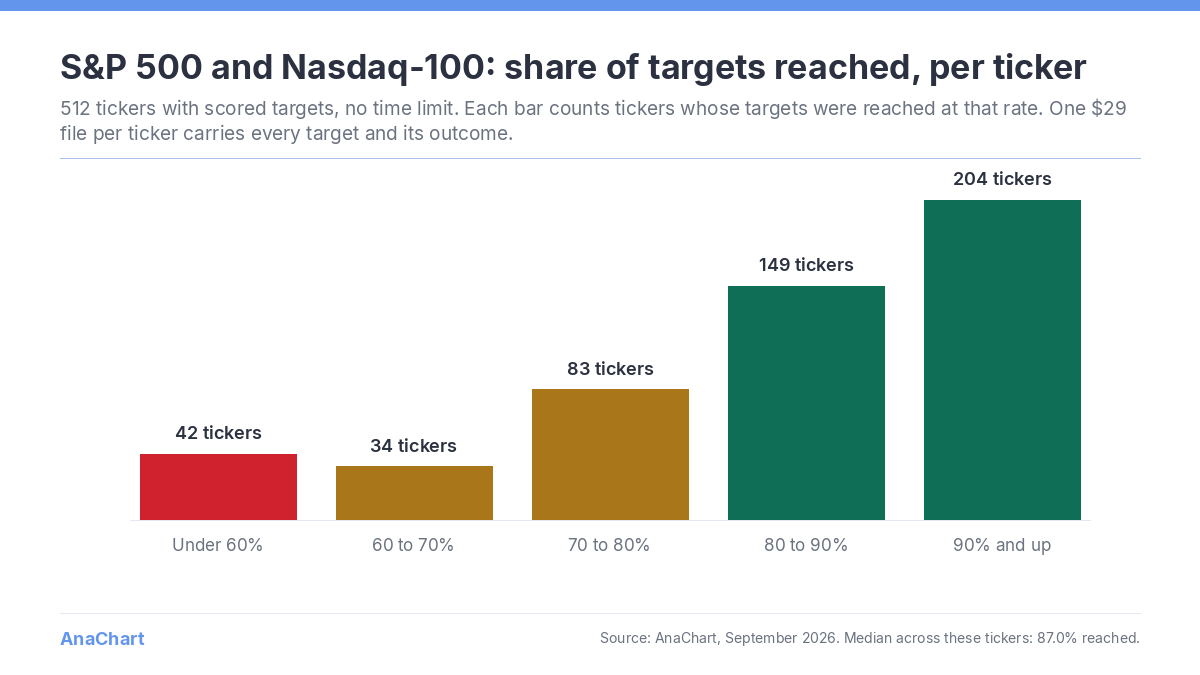
| Eligible tickers | 512 current S&P 500 and Nasdaq-100 names with scored targets, plus 607 Canadian and 184 German stocks typed with their exchange suffix (RY.TO, SAP.DE) |
| Delivery | Download link by email, usually within a minute |
| Price | $29, one-time, card only |
| Implied move | Each target against the close on the day it was published, in percent, signed; median across the 512 eligible tickers 13.3% |
| Not included | Closing prices (the direction and implied move columns carry the sign and the distance); other tickers are quoted cuts |
What arrives
A CSV with date, analyst (one identity across firms), broker, rating before and after, price target before and after (split-adjusted), the target as printed, the split ratio, direction, met, date met, days to hit. Closing prices are not included; the direction column records whether the target sat above or below the close on the day. Files for the tickers with scored targets are prepared in advance and arrive within minutes; anything else within one business day.
How it is scored
Direction is the target against the raw close on the day it was published. A target is reached when the stock trades through it in that direction on that day or any later day, with no time limit. Days to hit are calendar days to the first such day. Full method on the historical price targets page.
A question about the file, which analysts on this name reached their targets most often, how the brokers compare, how long targets took in a given year, is answered as a report. The first one is free.
Look before you buy
Every ticker in the record has a page at data.anachart.store with the analyst count, the share of targets reached, the median days to hit and the same figures by year, computed from the file this page sells. The Apple page is at data.anachart.store/ticker/AAPL/; replace the symbol for any other name.
Frequently asked questions
Which tickers are available?
Current S&P 500 and Nasdaq-100 constituents, about 520 names. Any other ticker in the record, 9K+ including delisted names, is available as a quoted cut, not as the $29 file; an order for a ticker outside the set is refunded in full or quoted, whichever you prefer.
Also 607 Canadian stocks (Toronto Stock Exchange, TSX Venture, Cboe Canada, CSE) and 184 German stocks, each with at least five scored targets. Type the ticker with its exchange suffix at checkout: RY.TO for Royal Bank of Canada, SAP.DE for SAP. Targets are in the local currency as published; the price is $29 all the same.
How current is the file?
To the last refresh of the record; the date of the last row is in the file. Refreshed versions are available on request.
Can I get several tickers?
Yes, one order per ticker within the eligible set. Anything wider, more names, a sector, a broker, the whole record, is a cut quoted to the job.
Is this the same data as the Apple sample?
Same scoring and the same layout, without the two closing-price columns the Apple file carries.